Slide Chart Industry Terms & Definitions
-
 Eyeletted Slide Chart Construction Style Terms
 -
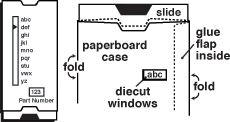 Folded and Glued Slide Chart Construction Style Terms
Slide Charts, Slide Rule Style Calculators and Data Reference Wheels are used everyday in industries around the world. To help you research your project, we've provided this list of terms, definitions and keywords.
If you are searching for a term not listed here or have other questions, Click here and let us know. We'll get back to you right away.
-
API Flange Slide Rule
Reference slide rule for gas and oil industries.
-
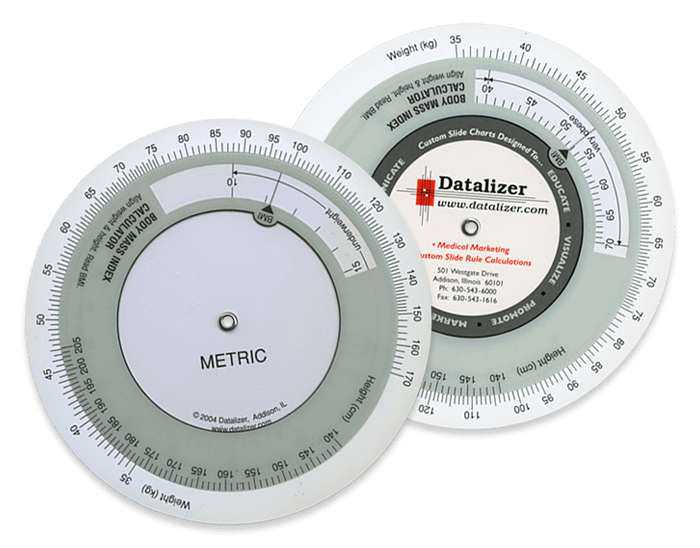
Body Mass Index Calculator / BMI
A Wheel Chart used to calculate healthy body weight based on a person's height.
-
Bookfold Slide Charts
Two or more slide charts hinged together to handle large volumes of data in a smaller slide chart format.
-
Circular 33
United States Copyright Office information sheet regarding computing and measuring devices. Click here to download a copy.
-
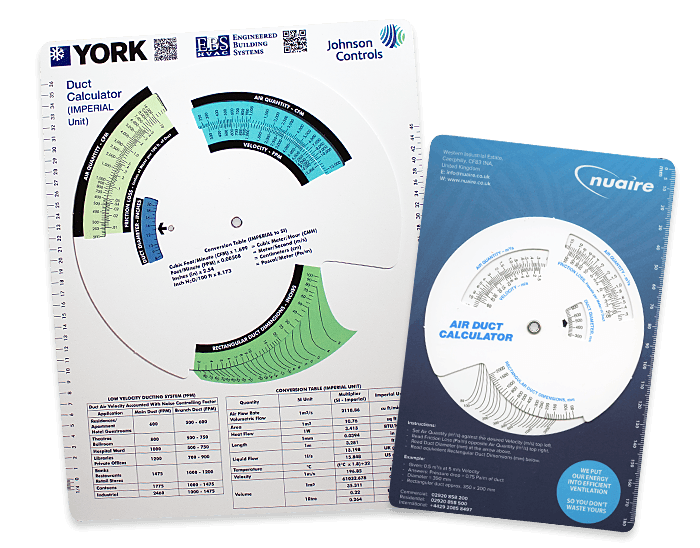
Circular Slide Chart
Two or more circles, disks or dials connected by a central hub. Dials revolve on the central hub to align slide rule style scales or to reveal hidden data in a die-cut window opening.
-
Comparison Charts
Slide and Wheel Charts designed to compare products or services and reveal differences.
-
Converter Slide Charts
Hand-held Slide and Wheel Charts used to convert from one measuring system to another. Examples: Metric Converter Slide Charts, Pressure Conversion Calculators, Metric Fastener Converters.
-
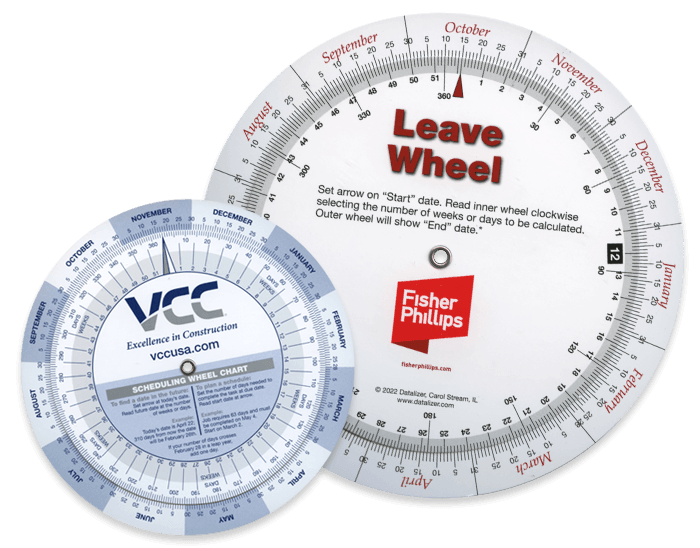
Date Calculator
Date Finder Wheel Charts for project planning and scheduling. Set a start date, read due dates, delivery dates, actionable dates.
-
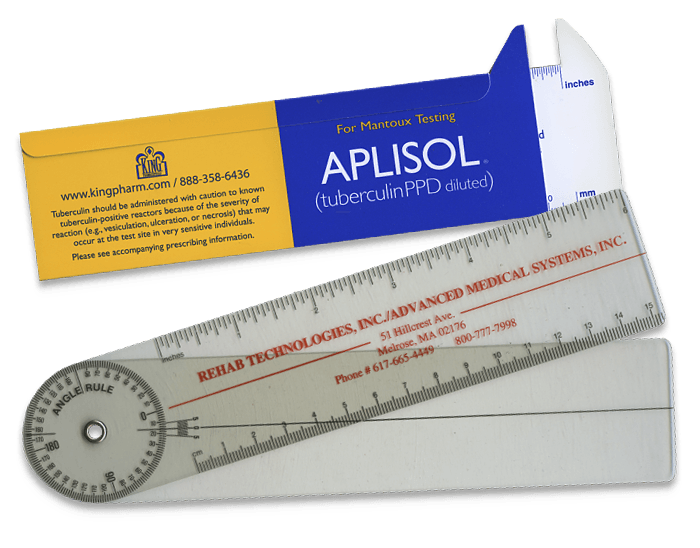
Dosing Slide Chart
Designed to aid medical professionals in administration of drug therapies. Also known as dosing calculators, dosage charts, dosage slide rules.
-
Energy Industry Slide Charts
Slide Charts used by industries involved in fuel extraction, manufacturing, refining, production and sale of energy. Examples: API Flange Slide Rules, Electrical Appliance Operation Cost Calculators, Heating Cost Comparison Slide Rules.
-
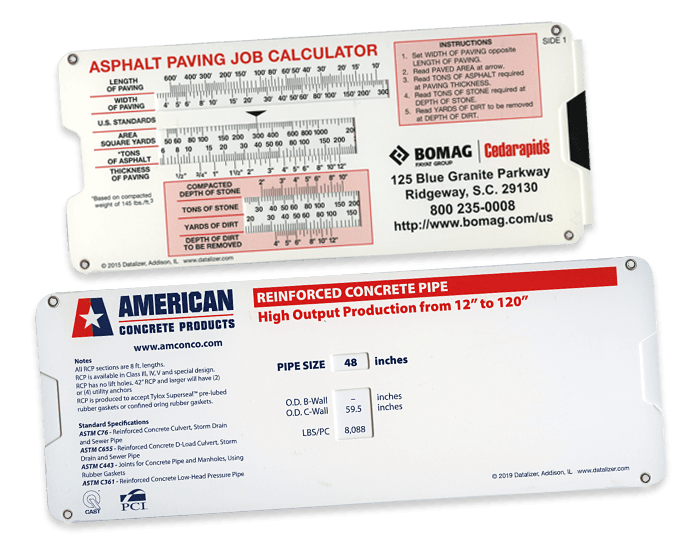
Engineering Slide Charts
Designed to simplify the creative application of technical concepts, products and calculations. Examples: Asphalt & Stone Calculators, Power Speed Calculators, Engineer's Quick Reference Slide Chart, kW-kVA-Amp Calculators, API Gravity/Density Calculators.
-
Environmental Industry Slide Charts
Designed to communicate info regarding issues and products related to ecology, environment, sustainability. Examples: Carbon Savings Calculators, Water Wheels, Recycling Wheel Charts, Emissions Conversion Slide Guides.
-
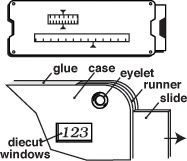
Eyelet
A small metal ring that is inserted into a hole made in calculator board or plastic. Holds together the component pieces of a slide chart or wheel chart. (Also called a grommet.)
-
Fan Pack
A card set grommeted together with a corner eyelet. Cards are rotated around the eyelet to display the data printed on each card. Also know as Card Sets, Swatch Packs and Swatchbooks.
-
Folded Sleeve Slide Guides
A folded outer sleeve, or case, is wrapped around a movable inner slide card. No eyelets are used in this construction style. Can be paperboard or plastic.
-
Goniometers
An instrument for measuring angles. A calibrated medical measuring device for measuring range of motion of joints.
-
Graphic Calculator Date Finder
Deluxe, all plastic Date Finder Calculator for professional schedulers. Originally sold by Graphic Calculator, Barrington, IL, no longer in business. A similar item is now available from Datalizer.
-
Green Marketing Data Charts
Designed to communicate information regarding issues and products related to ecology, environment, sustainability. Examples: Carbon Savings Calculators, Water Wheels, Recycling Wheels, Emissions Conversion Guides.
-
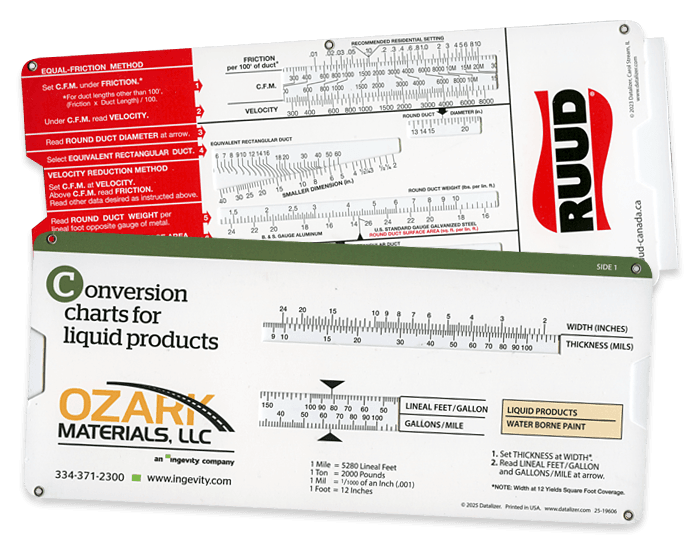
HVAC Calculators
Designed for the climate control industry. Heating, ventilating & air conditioning. Examples include: Air Velocity Calculator, Gas Pipe Sizing Calculator, Air & Gas Orifice Flow Calculator, Ductulator, Duct Wizard, Duct Design Calculator, Compressor Troubleshooting Guide, Flexible Duct Friction Loss Calculator.
-
Hydraulics Slide Chart Calculators
Efficient, accurate reference tools designed to present complex calculations for the plumbing industry. Examples include: Friction Loss Calculators, Drainage Pipe Sizing Selectors, Manning's Formula slide rules, Fluid Power Calculators, Hydraulic slide rules, Liquid Flow Calculators.
-
Linear Scale Slide Chart
A Slide Rule Style Calculator that uses scales with uniformly spaced divisions, as on a ruler.
-
Logarithmic Scale Slide Chart
A Slide Rule Style Calculator that uses the logarithm of a physical quantity instead of the quantity itself. A logarithmic scale is used when data covers a large range of values and reduces it to a more manageable range or size.
-
Mathematical Slide Charts
Slide Rule Style Calculators designed to simplify complex mathematical computations. Examples: Viscosity Conversion Calculators, Payload Slide Rule Style Slide Charts, Metric BMI Slide Rules, Power Distribution Slide Rule Calculators.
-
Medical & Pharmaceutical Slide Charts
Designed to meet the exacting requirements of medical and pharmaceutical applications and PhRMA guidelines. Examples: Dosage Calculators, Pregnancy Wheels, GFR Calculators, Medical Trials Schedulers.
-
Nomogram / Nomograph
A graphical calculating chart with three or more mathematical variables. Used to compute a function.
-
Planisphere
A Data Wheel Chart for mapping the positions of the stars. Also known as star charts and night sky maps.
-
Plastic Slide Charts & Wheel Charts
Printed on and constructed from plastic materials. Clear and white plastics are used to in a variety of combinations to make slide charts, wheel charts, templates and fan packs.
-
Point-of-Purchase (POP) Display Charts
In-store advertising designed to assist customers in self-service purchases.
Examples include:
Electric Lighting Selectors
Mini-Blind Sizers
Pet Food Specifier
Materials Estimator -
Pregnancy Wheel Charts
Used to determine probable date of conception and probable delivery date. Also known as due date calculators, gestation wheels, ovulation wheels.
-
Slide Chart
A hand-held device, usually of paperboard or plastic, designed to accommodate the organization and calculation of many diverse subjects.
-
Slide Chart Calculator
A manual computing device similar to a slide rule. Consists of a cover sleeve and an internal slider. The outer cover is formed into a sleeve open on the ends, through which a slider can be drawn. Moving the slider aligns scales for calculations or reveals data in specially die cut opening on the sleeve. Also known as: Slide Rule Calculator, Slide Calculator, Slide Guide.
-
Slide Rule Calculator
A manual computing device consisting of two rulers marked with graduated scales, one sliding against the other to perform specific calculations.
-
Slider
An information card of plastic or paperboard. Slips back and forth inside a cover case/carrier to reveal hidden information or perform calculations.
-
Slip Chart
A visual aid that reveals hidden data or images by moving a dial or card with and easy, sliding motion.
-
Swatchbook
Cards grommeted together with a corner eyelet. Cards fan out to display information printed on each card. Also know as Fan Packs, Card Sets, Swatch Packs.
-
Thumb Cut
Notch on the open ends of a slide chart making it easy to grasp and move the inside slider card.
-
Trapped Dial Volvelles
Booklet-style Wheel Chart with a rotating dial enclosed between 2 covers. May also include an additional cover and saddle-stitched insert pages. Also called Data Wheel brochures.
-
Visualizer
A data wheel chart or slide chart designed to demonstrate a mechanical action.
-
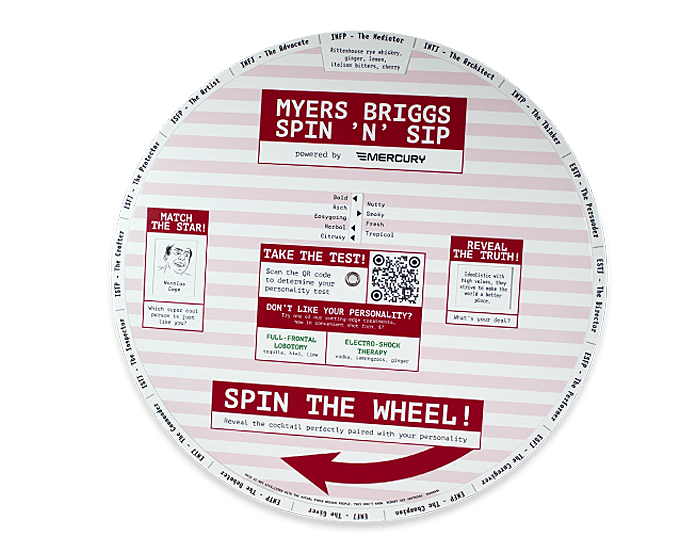
Volvelles
Concentric rotating disks. Also known as: Wheel Charts, Circular Slide Rules, Infographic Data Wheels, Trapped Dial Volvelles.
-
Wheel Chart
Two or more paperboard or plastic circles, connected by a central hub. One dial revolves on the central hub to align graduated scales or to reveal hidden information through a die cut opening. Also known as: circle charts, data dials, data disks, information dials, information discs, printed advertising wheels.
-
Work Day Conversion Wheel
A calendar wheel that adjusts for holidays and weekends in the scheduling function. Limited to specific time periods. New version is issued every year.